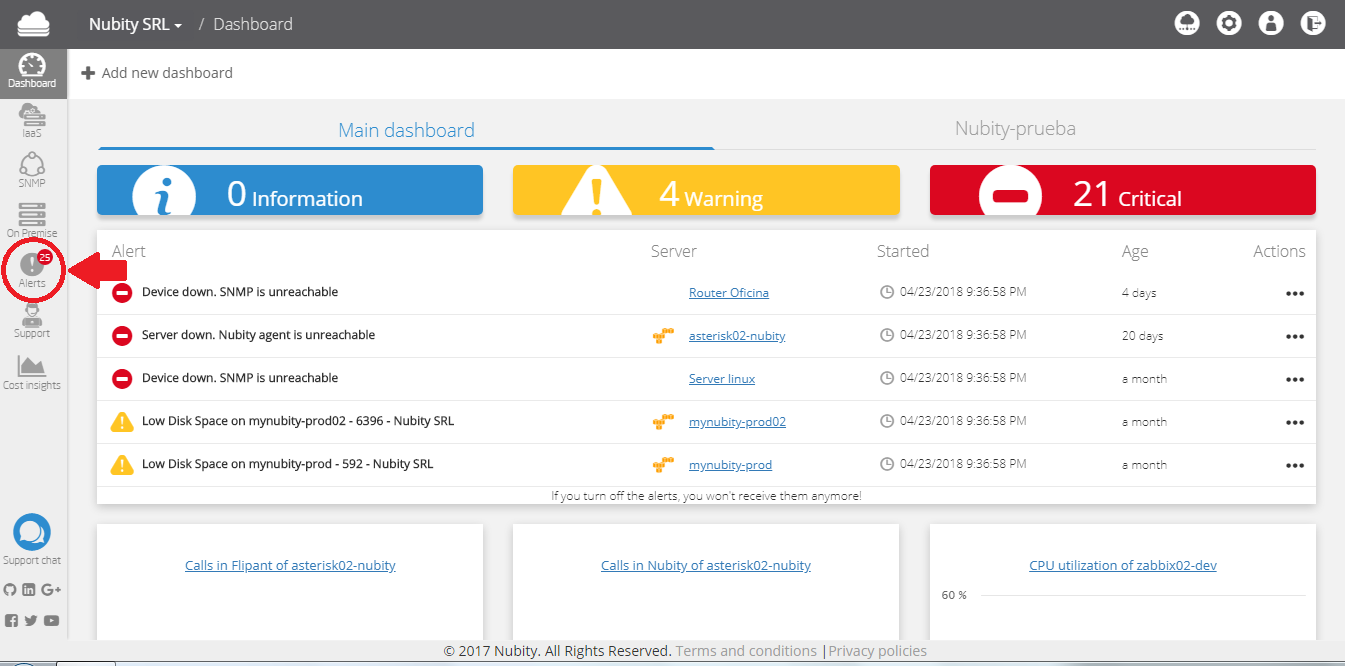
Alerts generated in your infrastructure are displayed on this Dashboard or if you prefer click on Alerts in the left side bar, as shown in the picture below:
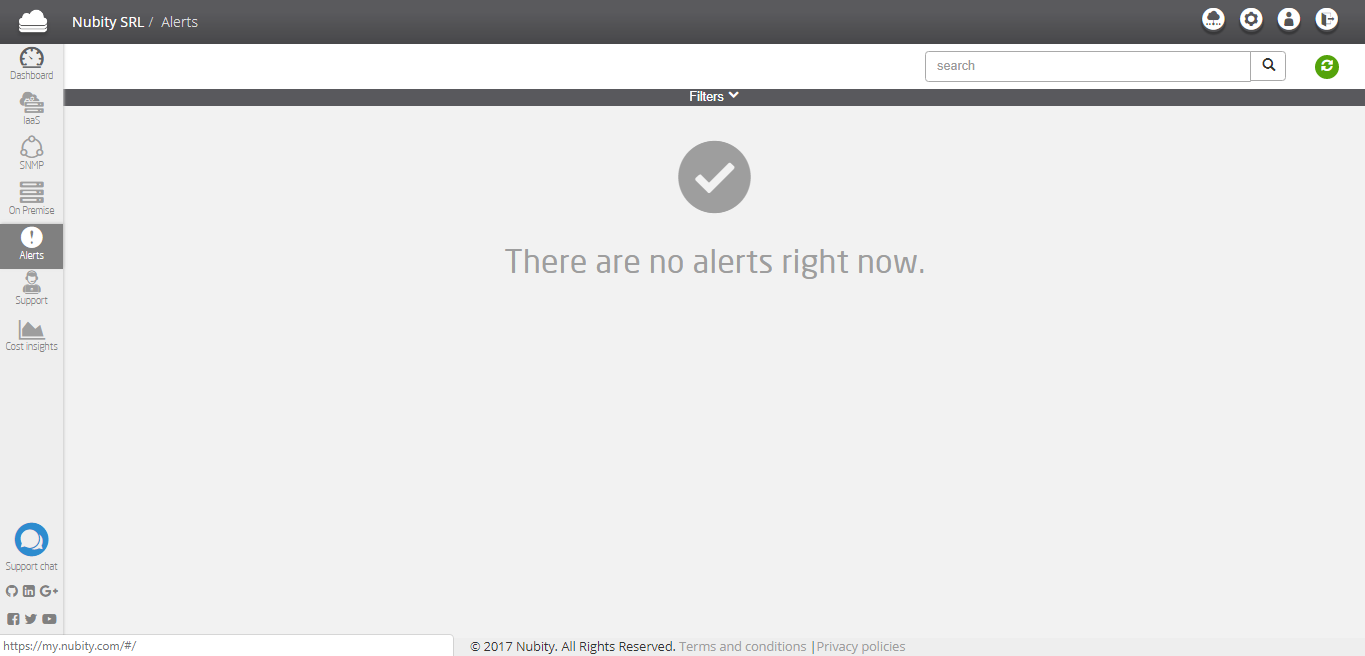
Then the next screen will be displayed:
Click on Filters and the next screen will be displayed:

The Filters top bar has two sections:
- By health; with the following options: Critical, Warning and Info.
- By Status; with the following options: Recent Problem and Resolved.
At the top right you will find a a search engine to quickly find a particular Alert about a particular server and the Refresh Data buttom to update the information about the generated alerts in any moment.
As seen in the previous image, there are no active alerts. Click on resolved in the section By Status at the top bar if you want to view the Alert history.
As seen in the previous image the Alerts are not activated. If you want to visualize the Alert history go to By Status at the top bar and click on Resolved:

As seen in the previous image yoo will find the following Data in the Alert list:
- Alert, Detail about the Alert generated.
- Server, Server Alerted.
- Started, Date/Time when it started.
- Duration, How long the alert lasted.
- Actions, the actions you can take about the alert, for example:
- Create ticket
- Edit monitoring configuration
Go to By Healt at the top bar to filter the alerts by severity. There are three alert severity levels:
- Info: An Info Alert is about some recent change, for example.
- Warning: A warning Alert is not about a current issue, is about a certantain information that brings to you the opportunity to avoid a future issue. Warning Alerts are proactive Alerts.
- Critical: A Critical Alert is about an scenario that requires immediate attention. This notifications indicates there is a current issue that needs someone to react as soon as possible. Critical Alerts are Reactive Alerts.
Yo can create a ticket for each Alert generated to notify the Nubity team and start to solve the issue. Go to Actions and click on Create ticket.

Click on Create Ticket and the next screen will be displayed:

To extra details about this process go to Create Ticket.
In the resolved alert list you will find informormation about when the alert started and when the alert was resolved. In adition you will find the history of the Alert to visualize how often the alert is generated.
Click on Resolved and the next screen will be displayed:

Then select any Alert and the next screen will be displayed:

As seen in the previous image, it is the same list with extra information about its duration and when started.
At the top right you will find a calendar. Go to the Calendar to set up a period time to visualize the Alerts. Next to the calendar you will find the Download Button. Click on it to download the Alert list in a CSV file.