Go to the left side bar and click on Cost Insights, then the next screen will be displayed:
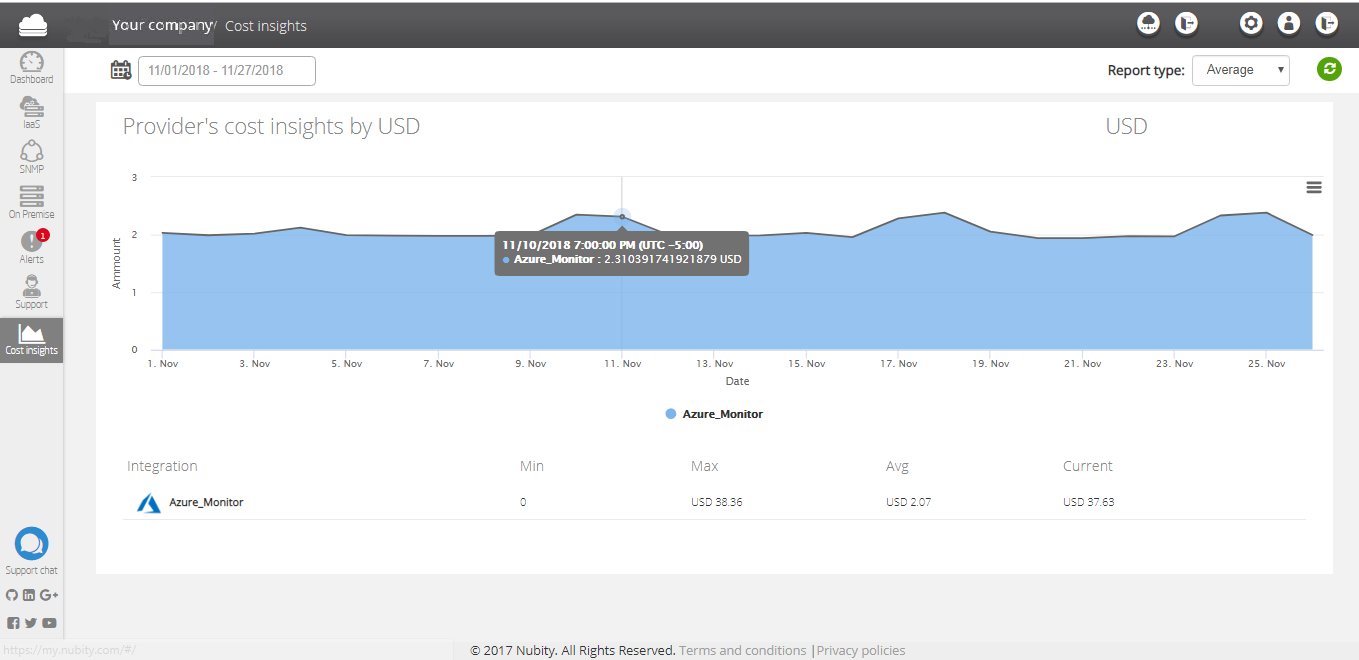
Here you can visualize the average cost of your Azure cloud integrated. You can set ups time periods. Click on the Calendar at the top left to select a time period.
Click on the integration if you want to see in detail the cost of each contracted service in Azure like we clicked on Azure_Monitor in the previous image and then the next screen will be displayed:

Here you can see in detail the cost of each Azure service represented with different colors. Nubity has the option to choose wich services to show in the cost graph. Click on each service to show it or hide it.
Bellow the graph you can find extra information about each service. Here you can find the following Data:
Service: Name of the Service.
Min: Minimal cost.
Max: Maximum cost.
Avg: Average cost.
Current: Current cost.
At the top rigth of the graph you will find a context menu:

Here you will find the different formats to download the graphic on the screen:
- PNG
- JPEG
- SVG
- CSV
- XLS