When you log into MyNubity after create a new user following the steps of Sing up to the platform, the next screen will be displayed:
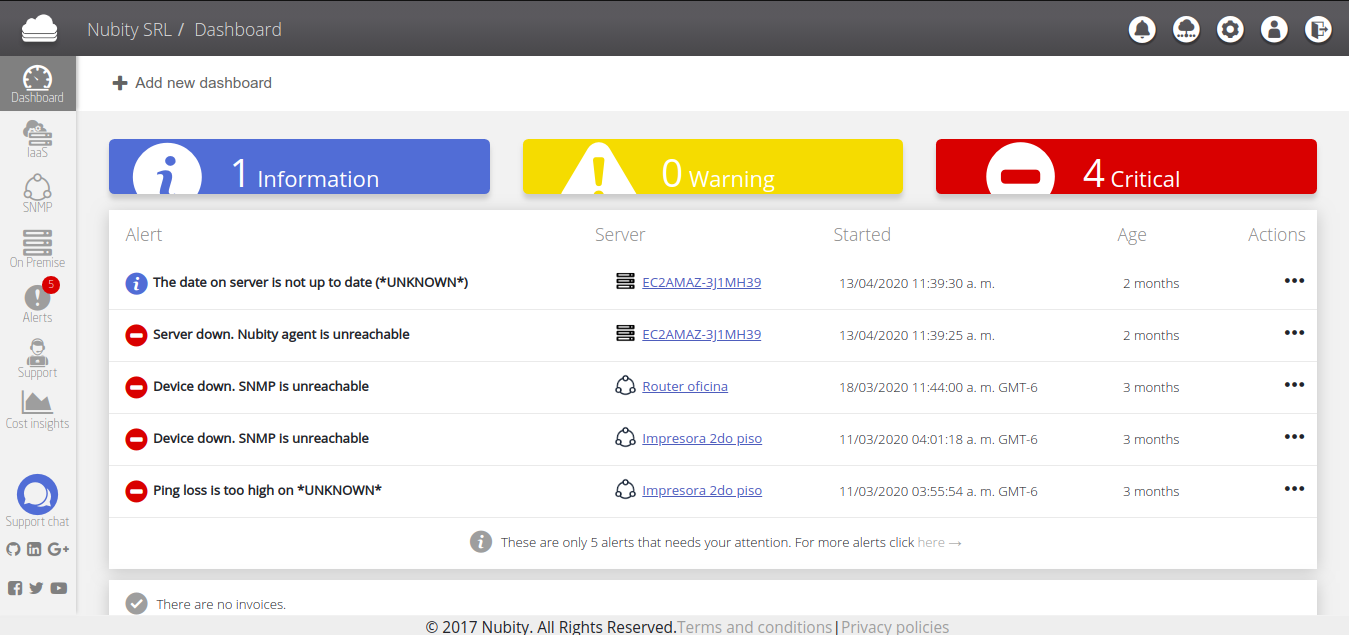
As seen in the previous image, this is the Dashboard when your account already contains an Integration or On Premise Integration. In this screen you can see the status of the integrated services. Here you also can see the three types of Alerts; Critical, Warning and Info. You can go to Notifications for extra details. You can create a support ticket for each Alert. Click on Actions and you’ll see the next options.
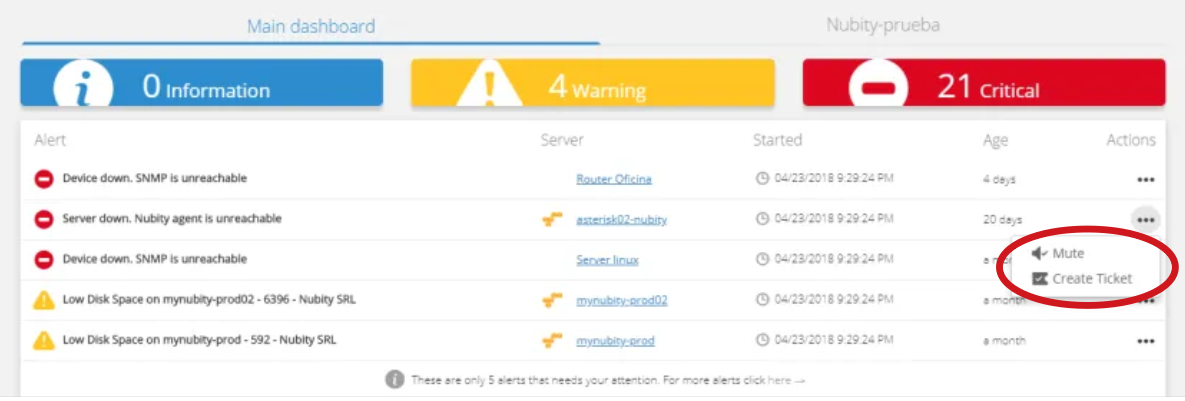
Then click on Create Ticket and the next screen will be displayed:

You can go to Create ticket for extra details. Mute option also can be selected to stop email notifications if necessary.
Additionally, three rotating graphs are displayed, showing the status of the integrated servers in real time.
At the top left you can click on Add New Dashboard and the next screen will be displayed:

To start this process first assign a name to the new performance Dashboard, then click on save and the Dashboard will be created. After that the next screen will be displayed:

Here you can set up a graph of each server you want to monitor, you only be able to configure until six graphs per Dashoard.If you need more graphics to display from one server or from other servers generate another performance Dashboard will be necessary in the same way as explained above.
When the Dashboard is already created you can set up the graphs. First select a server and then select a chart type. After that click on Create. The next screen will be displayed.
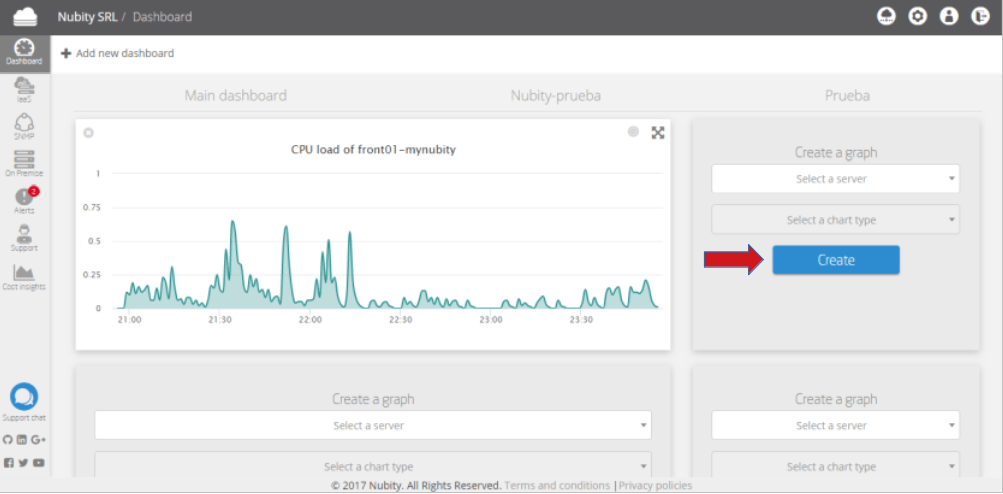
As seen in the previous image. After set up a graph you going to start vizualising the server performance in real time. You also can choose a time period for the graph, to this click on the Clock in the upper right corner:

Another option that you will find here is to enlarge the graph by clicking on the Arrows in the upper right corner next to the Clock. In case you no longer need the graph that you set up, you can delete it by clicking on the Cross button in the upper left side of the graph or clicking in the Remove Dashboard option at the end of the page.